Proven results with PONVORY®
PONVORY® was proven to help control the
symptoms and signs of relapsing multiple sclerosis
(MS)
About 1130 people participated in the ~2-year study that compared PONVORY® with Aubagio®. The clinical study showed:
PONVORY® was SUPERIOR at reducing
relapses and the number of new or enlarging lesions
vs a proven oral therapy (Aubagio®)*
PONVORY® slowed 3-month disability
progression in ~90% of people. There was no
statistically significant difference in the
percentages of people experiencing disability
progression between PONVORY® and
Aubagio®
*PONVORY® reduced the average number of new gadolinium-enhancing (GdE) T1 and new or enlarging T2 lesions.
Explore study results for PONVORY®
Be sure to talk to your healthcare professional about how MS impacts your body and the most important symptoms for you to manage.
PONVORY® helped reduce the average number of
relapses per year by 30.5% vs a proven oral
therapy (Aubagio®)†
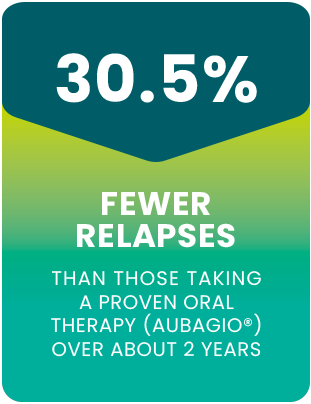
Relapses, also known as flare-ups, attacks, or exacerbations, occur when old MS symptoms get worse or new MS symptoms emerge. Some relapses produce 1 symptom, while others can cause 2 or more symptoms at the same time. These symptoms are different for everyone and can range from mild to severe.
†The average relapse rate per year was 0.202 for people taking PONVORY® (567 people) and 0.290 for people taking Aubagio® (566 people) over the course of the clinical study.
PONVORY® was proven to reduce the number of
new GdE
T1 lesions‡ and new or enlarging
T2 lesions§ VS A PROVEN ORAL
THERAPY (AUBAGIO®)
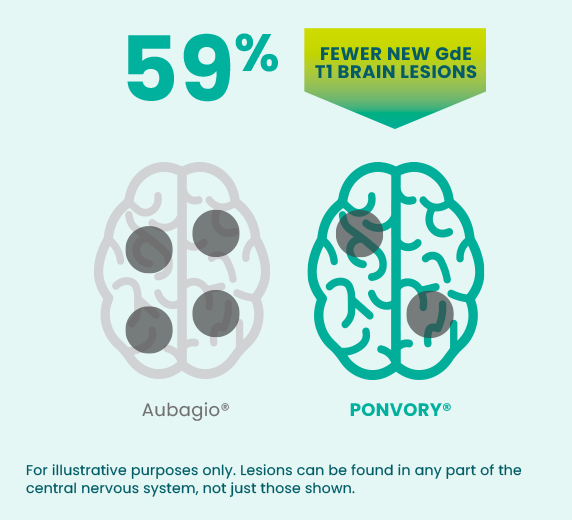
Over the course of the clinical study, people taking PONVORY® experienced an average of 0.18 GdE T1 lesions per magnetic resonance imaging (MRI) vs an average of 0.43 for people taking Aubagio®.
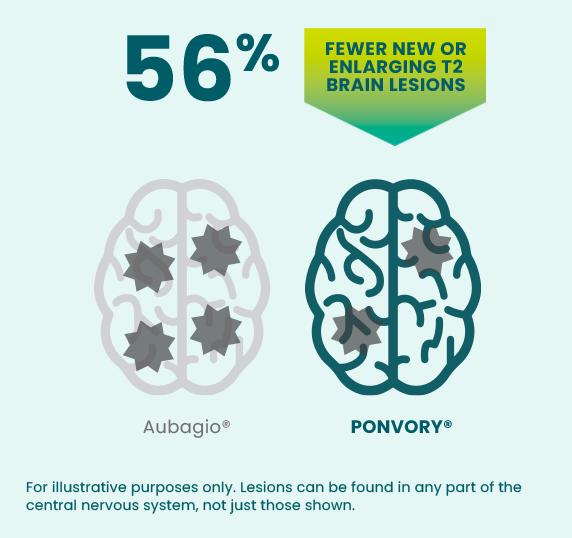
Over the course of the clinical study, people taking PONVORY® experienced an average of 1.4 new or enlarging T2 lesions per year vs an average of 3.16 for people taking Aubagio®.
‡Gadolinium is a contrast agent used in MRI scans that helps detect areas of new inflammation. T1 weighted imaging with gadolinium may show bright areas called enhancing lesions that indicate areas of active inflammation. The number of new GdE T1 lesions was measured by MRI at specific times in the study.
§T2 weighted MRI scans show overall disease burden or lesion load (the total number of lesions, both old and new). The number of new or enlarging T2 lesions (without double counting of lesions) was measured by MRI at specific times in the study.
For most people, disability symptoms didn’t
worsen with PONVORY® or a proven oral
therapy (Aubagio®)¶
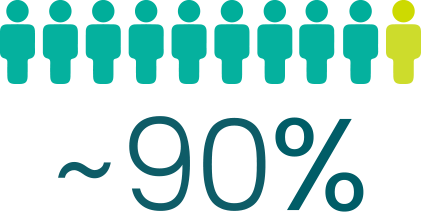
of people didn’t have a worsening of disability symptoms in the clinical study that lasted about 2 years#
The disability symptoms that were measured included: neurological function, mobility, the degree of daily walking activity, and the amount of assistance needed to perform routine tasks.
3-month confirmed disability
progression
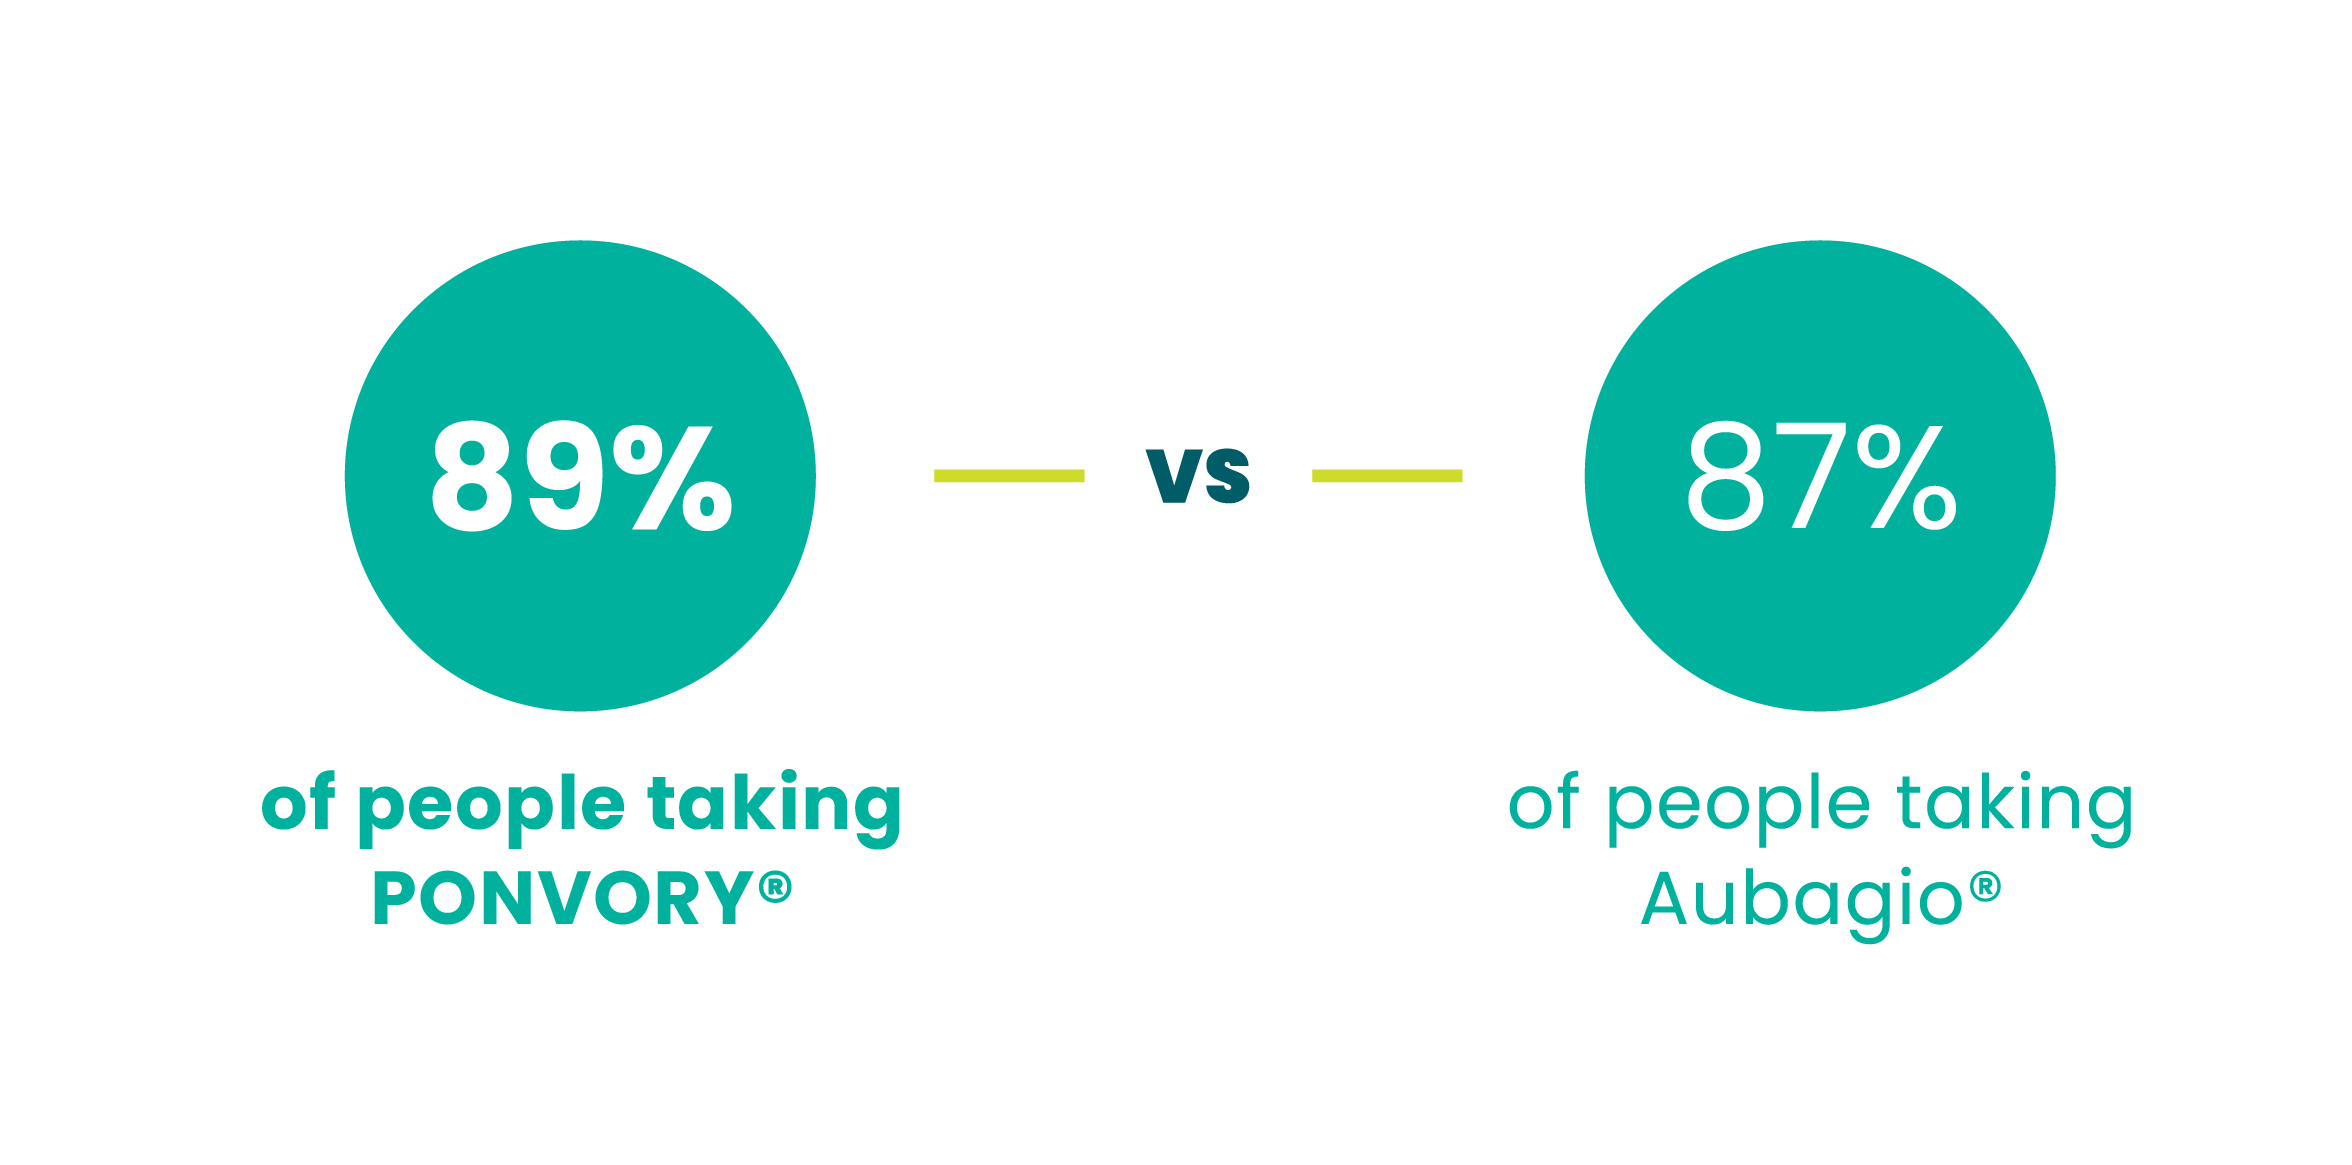
didn’t have a worsening of disability over 2 years‖
¶Over the course of the study, disability progression was similar in people taking PONVORY® and people taking Aubagio®. There was no statistically significant difference between the PONVORY® and Aubagio® groups.
#Disability progression was determined with predefined increases in Expanded Disability Status Scale (EDSS) scores, which were confirmed after 3 months over the course of the ~2-year study.
‖3-month disability progression was observed in 10.8% of people taking PONVORY® vs 13.2% of people taking Aubagio®.
